How Many Candlestick Patterns Are There? A Complete Beginner’s Guide
Candlestick charts can feel intimidating at first—like trying to read a secret code in the world of trading. But once you crack that code, you’ll start seeing the market with new eyes. In this guide, we’ll explore how many candlestick patterns are there, the art of how to read a candle chart, and how you can learn more through online stock market courses that make technical analysis easier than ever.
Think of this as your friendly walkthrough of candlestick charts—the building blocks of every trader’s strategy.
Learn how many candlestick patterns are there, how to read a candle chart, and explore online stock market courses for mastering trading basics.
What Are Candlestick Patterns?
Candlestick patterns are visual clues that traders use to understand price movements in the market. Each “candle” represents a snapshot of market activity within a given time frame. Together, these candles form recognizable patterns that help predict possible future movements—essentially showing market psychology in action.
Imagine every candle as a storyteller—it tells you where the market started (open), how high or low it went, and where it ended (close).
The Origin of Candlestick Charts
Candlestick charts didn’t start in Wall Street—they came from Japanese rice traders in the 18th century. One famous trader, Munehisa Homma, used candlestick charts to record price movements and predict market behavior. These charts proved incredibly insightful, and today, they’re a global foundation of technical analysis.
Why Candlestick Patterns Matter in Trading
Candlestick patterns help traders make smarter decisions. They reveal momentum, trends, and reversals—essential information whether you’re trading stocks, forex, or crypto.
Think of it as reading facial expressions in a conversation. A market’s “mood” shows up in its candles: excitement, fear, hesitation, or confidence.
Structure of a Single Candle
Every candle has three main parts:
- Body: The colored section showing the range between the opening and closing price.
- Wick (or Shadow): Lines above and below the body showing price highs and lows.
- Color: Usually green (bullish) or red (bearish)—though colors may vary with different charting tools.
For example, a long green candle means “buyers were in control,” whereas a long red candle tells you “sellers dominated.”
How to Read a Candle Chart
Learning how to read a candle chart is key to understanding market trends. Here’s the basic idea:
- A bullish candle (usually green) forms when the closing price is higher than the opening price.
- A bearish candle (usually red) forms when the closing price is lower than the opening price.
- Long wicks indicate volatility—markets moved sharply but couldn’t hold those levels.
To read patterns effectively, watch multiple candles together instead of just one. Like sentences form meaning out of words, multiple candles tell a full story.
Types of Candlestick Patterns
There are three major categories:
- Single candlestick patterns – individual candles signaling quick reversals.
- Double candlestick patterns – two-candle combinations showing shifts in momentum.
- Triple candlestick patterns – three-candle setups confirming larger trend changes.
Single Candlestick Patterns
Single candlestick patterns are simple but powerful. A few key ones include:
- Doji: The opening and closing prices are nearly identical—indicating indecision in the market.
- Hammer: Appears after a downtrend, showing potential bullish reversal.
- Shooting Star: Appears after an uptrend, signaling bearish reversal.
- Spinning Top: Small body, long wicks—market uncertainty.
Imagine a hammer as an effort to “hammer out the bottom” of a downtrend, while a shooting star signals the market has “flown too high.”
Double Candlestick Patterns
These patterns use two consecutive candles to identify turning points:
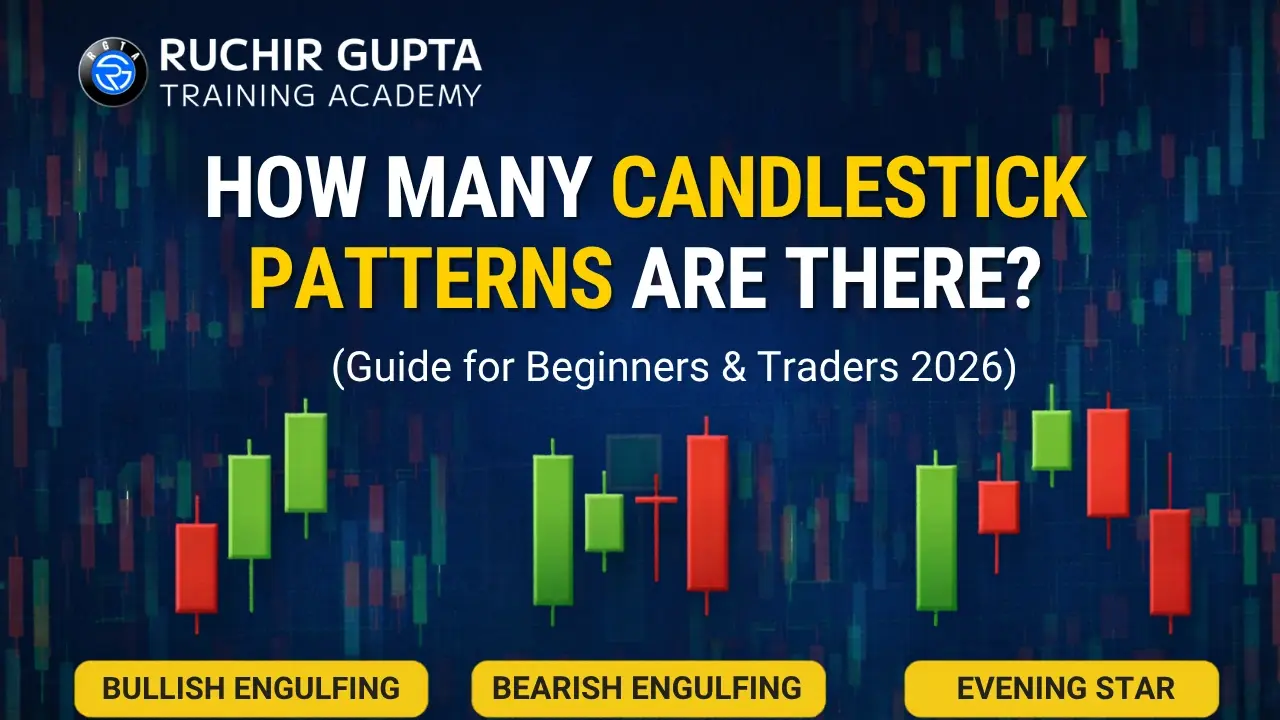
- Bullish Engulfing: A large green candle completely covers the previous red one—buyers taking control.
- Bearish Engulfing: A large red candle overwhelms a smaller green—indicating sellers are back.
- Tweezer Tops and Bottoms: When two candles share similar highs or lows, showing potential reversal zones.
Think of them as dance partners—when momentum changes hands, the market rhythm shifts.
Triple Candlestick Patterns
Triple patterns confirm more significant reversals or continuations. Examples include:
- Morning Star: A bullish reversal formed by three candles—red, small-bodied candle, and a strong green candle.
- Evening Star: The bearish counterpart signaling trend reversal downward.
- Three White Soldiers: Three consecutive strong green candles suggesting continued buying strength.
- Three Black Crows: Opposite pattern showing selling pressure across three red candles.
These patterns are highly reliable and often used to confirm shifts in long-term trends.
Reversal vs. Continuation Patterns
Candlestick patterns fall into two big buckets:
- Reversal patterns: Indicate trend shifts—like going from downward to upward (or vice versa).
- Continuation patterns: Suggest the existing trend will keep going.
Recognizing the difference helps traders position themselves with better timing and confidence.
How Many Candlestick Patterns Are There Exactly?
Here’s the big answer you’ve been waiting for—how many candlestick patterns are there?
In total, analysts recognize around 42 major candlestick patterns based on different combinations of candle shapes and sequences. These fall broadly into categories of bullish, bearish, and neutral signals.
However, trading experts often focus on about 20–30 key patterns since those appear most frequently and carry stronger predictive value. The exact number can vary slightly depending on which trading school or course you follow.
Most Popular Candlestick Patterns Explained
Here are some widely used patterns you’ll encounter in chart analysis:
- Bullish Engulfing: Marks strong buying momentum and potential trend reversal.
- Bearish Engulfing: Warns of selling strength ahead.
- Hammer and Hanging Man: Show turning points at trend extremes.
- Doji Variants: Represent indecision and upcoming volatility.
- Morning and Evening Star: Predict shifts in long-term directions.
- Three Soldiers/Crows: Confirm powerful trend continuation.
These patterns form the foundation of how traders interpret markets globally.
Common Mistakes Traders Make
While reading candlestick patterns is valuable, beginners often make mistakes like:
- Trying to predict every move from a single candle.
- Ignoring broader market context such as volume or support/resistance zones.
- Overtrading based on pattern recognition without confirmation.
A good rule? Treat candlestick patterns like clues, not final verdicts. They guide—but shouldn’t dominate—your decision-making.
How to Practice Reading Candle Charts
- Use free demo accounts or paper trading platforms.
- Focus on one asset at a time (e.g., a single stock or crypto pair).
- Keep a trading journal to note patterns and outcomes.
- Review historical charts to spot common patterns.
Like learning a language, regular practice builds fluency in chart reading.
Learning Candlestick Patterns Through Online Stock Market Courses
If you’re eager to learn systematically, online stock market courses can make a huge difference. These courses break down technical terms and offer hands-on chart reading practice.
You’ll often find modules covering:
- How to read a candle chart
- Identifying reversal and continuation signals
- Applying patterns in trading strategies
- Risk management techniques
Platforms like Coursera, Udemy, or specialized trading academies in India offer beginner-friendly lessons. Look for interactive sessions with real market examples—that’s where learning sticks.
Final Thoughts
Candlestick patterns are like the heartbeat of the market—revealing rhythm, strength, and emotional tone. Understanding how many candlestick patterns are there and how to read a candle chart helps any investor see beyond raw numbers. Combine that knowledge with quality online stock market courses, and you’ll have the tools to decode the market with confidence.
Trading may seem complex, but remember—it’s just a dialogue between buyers and sellers, written in candles.
FAQs
1. How many candlestick patterns are there in total?
There are approximately 42 recognized candlestick patterns, though most traders focus on 20–30 commonly used ones.
2. How can beginners learn to read candle charts easily?
Start with the basics—practice identifying bullish and bearish candles, then move to simple patterns like hammers and dojis.
3. Are candlestick patterns reliable for stock market predictions?
They’re helpful indicators, but not foolproof. Use them alongside other tools like volume, trend lines, and fundamental analysis.
4. Can I learn candlestick patterns through online courses?
Absolutely! Many online stock market courses teach pattern recognition, chart reading, and hands-on practice sessions.
5. How long does it take to master candlestick reading?
With regular study and practice, even beginners can become comfortable in a few weeks. Real mastery, though, builds over months of consistent observation.