Understanding the Dark Cloud Cover Pattern
Have you ever looked at a stock chart and wondered when a rising market might suddenly turn sour? The dark cloud cover pattern is one such indicator that traders watch closely. It signals a possible reversal from an uptrend to a downtrend, warning investors to be cautious. This candlestick pattern is essential for anyone interested in the stock market, especially if you’re considering an online stock market course to enhance your trading skills.
Let’s dive into what the dark cloud cover pattern is, how to identify it, and why it matters. Think of it as a storm cloud forming right at the peak of a sunny day, hinting that rough weather (or a price decline) might be on its way.
Discover the dark cloud cover pattern and dark cloud cover candlestick pattern to spot market reversals. Enroll in an online stock market course for expert trading insights.
What is the Dark Cloud Cover Pattern?
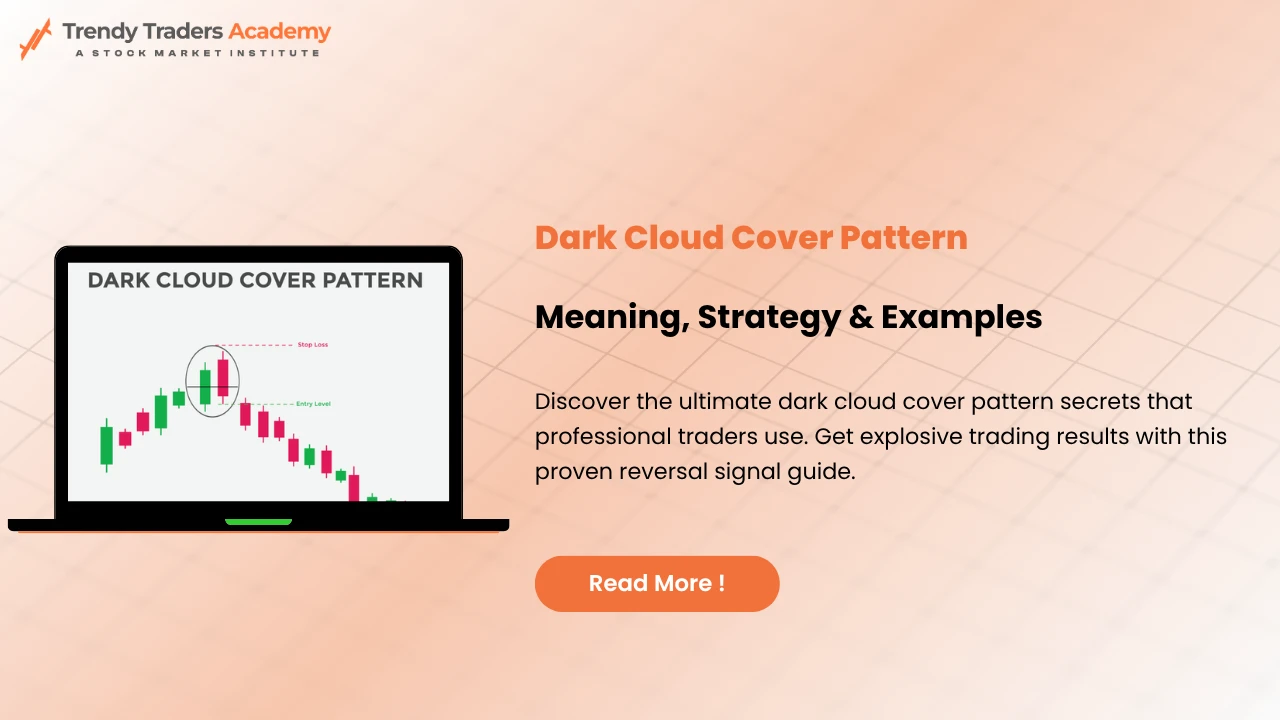
The dark cloud cover pattern is a candlestick reversal pattern that often indicates a potential end of an existing uptrend. Imagine a hot sunny day that suddenly clouds over — the bright upward momentum gets overshadowed by a dark weather shift. This pattern appears when a usually bullish (green) candle is followed by a bearish (red) candle that closes below the midpoint of the previous bullish candle.
It’s like a warning flag for traders, signaling that buying pressure might be waning and selling pressure is gaining ground. Recognizing this pattern early can help you make smarter decisions about whether to hold or sell your stocks.
How Does the Pattern Form?
The dark cloud cover pattern forms in a sequence:
- An uptrend is already underway.
- The first candle is bullish, showing strong buying activity.
- The next day, there’s a gap up, meaning opening price is higher than the previous close, giving the impression of continued strength.
- But suddenly, the second candle turns bearish.
- The crucial part? It closes below the midpoint of the first candle’s body.
Think of it like a balloon being stretched; it looks firm but then suddenly deflates — signaling a possible reversal.
Key Components of the Pattern
To spot this pattern, look for:
- An existing uptrend.
- A long bullish candle (green or white).
- A gap up between the two candles.
- A red or black candle that closes below the midpoint of the previous candle.
- Large bodies for both candles, indicating strong market sentiment.
This combination suggests that sellers have gained control, overriding the prior bullish momentum.
Recognizing the Pattern on Charts
When analyzing candlestick charts, identify the first long bullish candle at the top of an uptrend, followed by a bearish candle that has:
- Opened above the previous close (gap up).
- Closed below the midpoint of the prior candle.
- Has a large body, indicating strong selling.
Picture the pattern as a long green flag suddenly shadowed with a red storm cloud, indicating a possible storm (price reversal).
Significance of the Dark Cloud Cover Pattern
Why do traders care about this pattern? Because it can be a powerful signal that the uptrend is reversing. It shows that sellers are overwhelming buyers.
However, like all signals, it’s not foolproof — context matters. Confirm the pattern with other indicators such as volume or RSI to avoid false alarms.
Trading Strategies Using the Pattern
Once you spot a dark cloud cover, the typical approach is:
- Wait for confirmation: Look for additional signs of a downtrend.
- Enter a short position: When other indicators support the reversal.
- Set stop-losses above recent highs.
- Monitor volume: Higher volume during the pattern increases its reliability.
Think of it like weather forecasting — one cloud alone may not cause a storm, but a gathering of clouds signals trouble.
Confirming Reversals with Other Indicators
To improve reliability, combine candlestick patterns with:
- Moving averages (e.g., 20 or 50 SMA)
- Volume spikes
- RSI dropping below 30
- MACD crossover
This combined approach helps verify that a real trend change is happening, reducing the risk of acting on false signals.
Limitations and False Signals
Remember, no pattern is perfect. Sometimes, what looks like a dark cloud cover is just a brief dip before continuing upward. Such false signals can mislead traders.
It’s crucial to assess the market context, trend strength, and confirmation signals to avoid premature trades.
Practical Examples and Case Studies
Suppose a stock has been rising steadily for weeks. Suddenly, a candle appears that gaps up but then closes below the midpoint of the prior candle. If volume also spikes downward, it’s a strong sign that selling momentum is rising. Many traders then decide to exit or short-sell.
Real-world examples show how spotting this pattern early can help protect gains or capitalize on reversals.
The Pattern in Different Market Conditions
While most observed at the end of bullish rallies, the dark cloud cover can appear in volatile or uncertain markets. Its reliability increases after a strong, prolonged uptrend but diminishes during choppy or sideways markets.
Always adapt your strategy based on overall market health and other confirmed signals.
Enhancing Your Trading Skills with Online Stock Market Courses
If you’re eager to grasp candlestick patterns like the dark cloud cover more deeply, consider enrolling in an online stock market course. These courses offer structured lessons, practical examples, and expert guidance, helping you develop confidence in your trading decisions.
Common Mistakes to Avoid
- Relying solely on one pattern without confirmation.
- Ignoring overall trend conditions.
- Reacting prematurely without volume or other indicators.
- Overtrading based on choppy signals.
Being aware of these pitfalls can enhance your trading success.
Tips for New Traders
Start small, practice with demo accounts, and always wait for confirmation signals. Remember, patience and discipline are key in trading. Learning candlestick patterns like the dark cloud cover is a step toward becoming a more confident investor.
Final Thoughts and Summary
The dark cloud cover pattern is a valuable tool in a trader’s arsenal for spotting possible reversals. Recognizing it accurately requires understanding its formation, context, and confirming signals. As with any trading strategy, combining patterns with other indicators and proper risk management is essential.
And if you’re serious about mastering these techniques, taking an online stock market course can accelerate your learning and improve your results.
FAQs
Q1: What exactly is the dark cloud cover pattern?
A: It’s a candlestick pattern indicating a potential reversal from an uptrend, formed when a bullish candle is followed by a bearish candle closing below the midpoint of the previous candle.
Q2: How can I identify the dark cloud cover on a chart?
A: Look for a strong green candle, followed by a gap up, and then a red candle that closes below the midpoint of the green candle.
Q3: Is this pattern reliable for trading?
A: It’s a useful indicator, but should always be confirmed with other signals like volume or technical indicators.
Q4: Can I learn this pattern in an online stock market course?
A: Absolutely! Many courses teach candlestick patterns with practical examples to help you spot them confidently.
Q5: When should I avoid relying on the dark cloud cover pattern?
A: During highly volatile markets or sideways trading, as false signals are more common.